In this post, We’ll talk about Scala cats‘s traverseWithIndexM’:
- What is traverseWithIndexM
- Benchmark of traverseWithIndexM in comparison with other isomorphic functions
- Conclusion
What is traverseWithIndexM
First thing first, before we don’t want to use something, we need to know exactly what it is right? The signature of traverseWithIndexM is below:
  /**
   * Akin to [[traverse]], but also provides the value's index in
   * structure F when calling the function.
   *
   * This performs the traversal in a single pass but requires that
   * effect G is monadic. An applicative traversal can be performed in
   * two passes using [[zipWithIndex]] followed by [[traverse]].
   */
  def traverseWithIndexM[G[_], A, B](fa: F[A])(f: (A, Int) => G[B])(implicit G: Monad[G]): G[F[B]]
It is basically equal to zipWithIndex.traverse (or zipWithIndex.map.sequence), but it seems to be faster because it traverses the whole collection in one pass (with a small catch which is the effect G has to be a Monad). But is it? Let’s find by doing some benchmark.
Benchmark
We’ll compare performance of three isomorphic functions: traverseWithIndexM vs zipWithIndex.traverse and zipWithIndex.map.squence. We can already suspect that the third one will be slower than the second one, but let the reality confirms our prediction.
We’ll use jmh with scala-cli to do our benchmark (it’s always amazed me, how so easy it is to do these kinds of benchmarks, thanks Scala team for that), and here is the code:
//> using scala 3.3.0
//> using toolkit typelevel:latest

package bench

import cats.syntax.all.*
import org.openjdk.jmh.annotations.*
import java.util.concurrent.TimeUnit
import org.openjdk.jmh.infra.Blackhole

@State(Scope.Thread)
@BenchmarkMode(Array(Mode.Throughput))
@OutputTimeUnit(TimeUnit.SECONDS)
@Measurement(iterations = 15, timeUnit = TimeUnit.SECONDS, time = 3)
@Warmup(iterations = 15, timeUnit = TimeUnit.SECONDS, time = 3)
@Fork(3)
@Threads(value = 1)
class CatsTraverseWithIndex:

  private[this] val Work: Long = 2
  @Param(Array("50", "1000", "100000", "10000000"))
  var size: Int = _

  var xs: List[Int] = _

  @Setup
  def setup =
    xs = (1 to size).toList

  @Benchmark
  def traverseWithIndexM =
    xs.traverseWithIndexM: (x, i) =>
      Blackhole.consumeCPU(Work)
      (x + i).some

  @Benchmark
  def zipMapSequence =
    xs.zipWithIndex.map: (x, i) =>
      Blackhole.consumeCPU(Work)
      (x + i).some
    .sequence

  @Benchmark
  def zipTraverse =
    xs.zipWithIndex.traverse: (x, i) =>
      Blackhole.consumeCPU(Work)
      (x + i).some
And we can run it with scala-cli –jmh CatsTraverseWithIndex.scala. But if you want to run that by yourself, you’d better to prepare some coffee and something to kill time (it’ll take 1 hours or so to run the whole things). But don’t worry, I already done that for you, here is the result:
# JMH version: 1.29
# VM version: JDK 20.0.2, OpenJDK 64-Bit Server VM, 20.0.2+9
# VM invoker: /Library/Java/JavaVirtualMachines/temurin-20.jdk/Contents/Home/bin/java
# VM options: <none>
Benchmark                                   (size)   Mode  Cnt       Score      Error  Units
CatsTraverseWithIndex.traverseWithIndexM        50  thrpt   45  234343.000 ±  828.583  ops/s
CatsTraverseWithIndex.traverseWithIndexM      1000  thrpt   45    9229.621 ±   26.439  ops/s
CatsTraverseWithIndex.traverseWithIndexM    100000  thrpt   45      62.792 ±    0.482  ops/s
CatsTraverseWithIndex.traverseWithIndexM  10000000  thrpt   45       0.320 ±    0.011  ops/s
CatsTraverseWithIndex.zipMapSequence            50  thrpt   45  493576.533 ± 2799.970  ops/s
CatsTraverseWithIndex.zipMapSequence          1000  thrpt   45   17072.587 ±   52.702  ops/s
CatsTraverseWithIndex.zipMapSequence        100000  thrpt   45     133.627 ±    0.631  ops/s
CatsTraverseWithIndex.zipMapSequence      10000000  thrpt   45       0.310 ±    0.049  ops/s
CatsTraverseWithIndex.zipTraverse               50  thrpt   45  559966.293 ± 7139.022  ops/s
CatsTraverseWithIndex.zipTraverse             1000  thrpt   45   19432.657 ±  116.109  ops/s
CatsTraverseWithIndex.zipTraverse           100000  thrpt   45     126.553 ±    2.124  ops/s
CatsTraverseWithIndex.zipTraverse         10000000  thrpt   45       0.419 ±    0.023  ops/s
In all benchmarks, higher numbers are better. We can see that traverseWithIndexM is always slower than its colleagues. More than two times slower when the size of the collections are small, the gap is smaller when the size is increased. But that not the only problem with traverseWithIndexM, here is the flamegraph produced with async-profiler of traverseWithIndexM and zip.traverse when running benchmark with size of 1000, side by side.
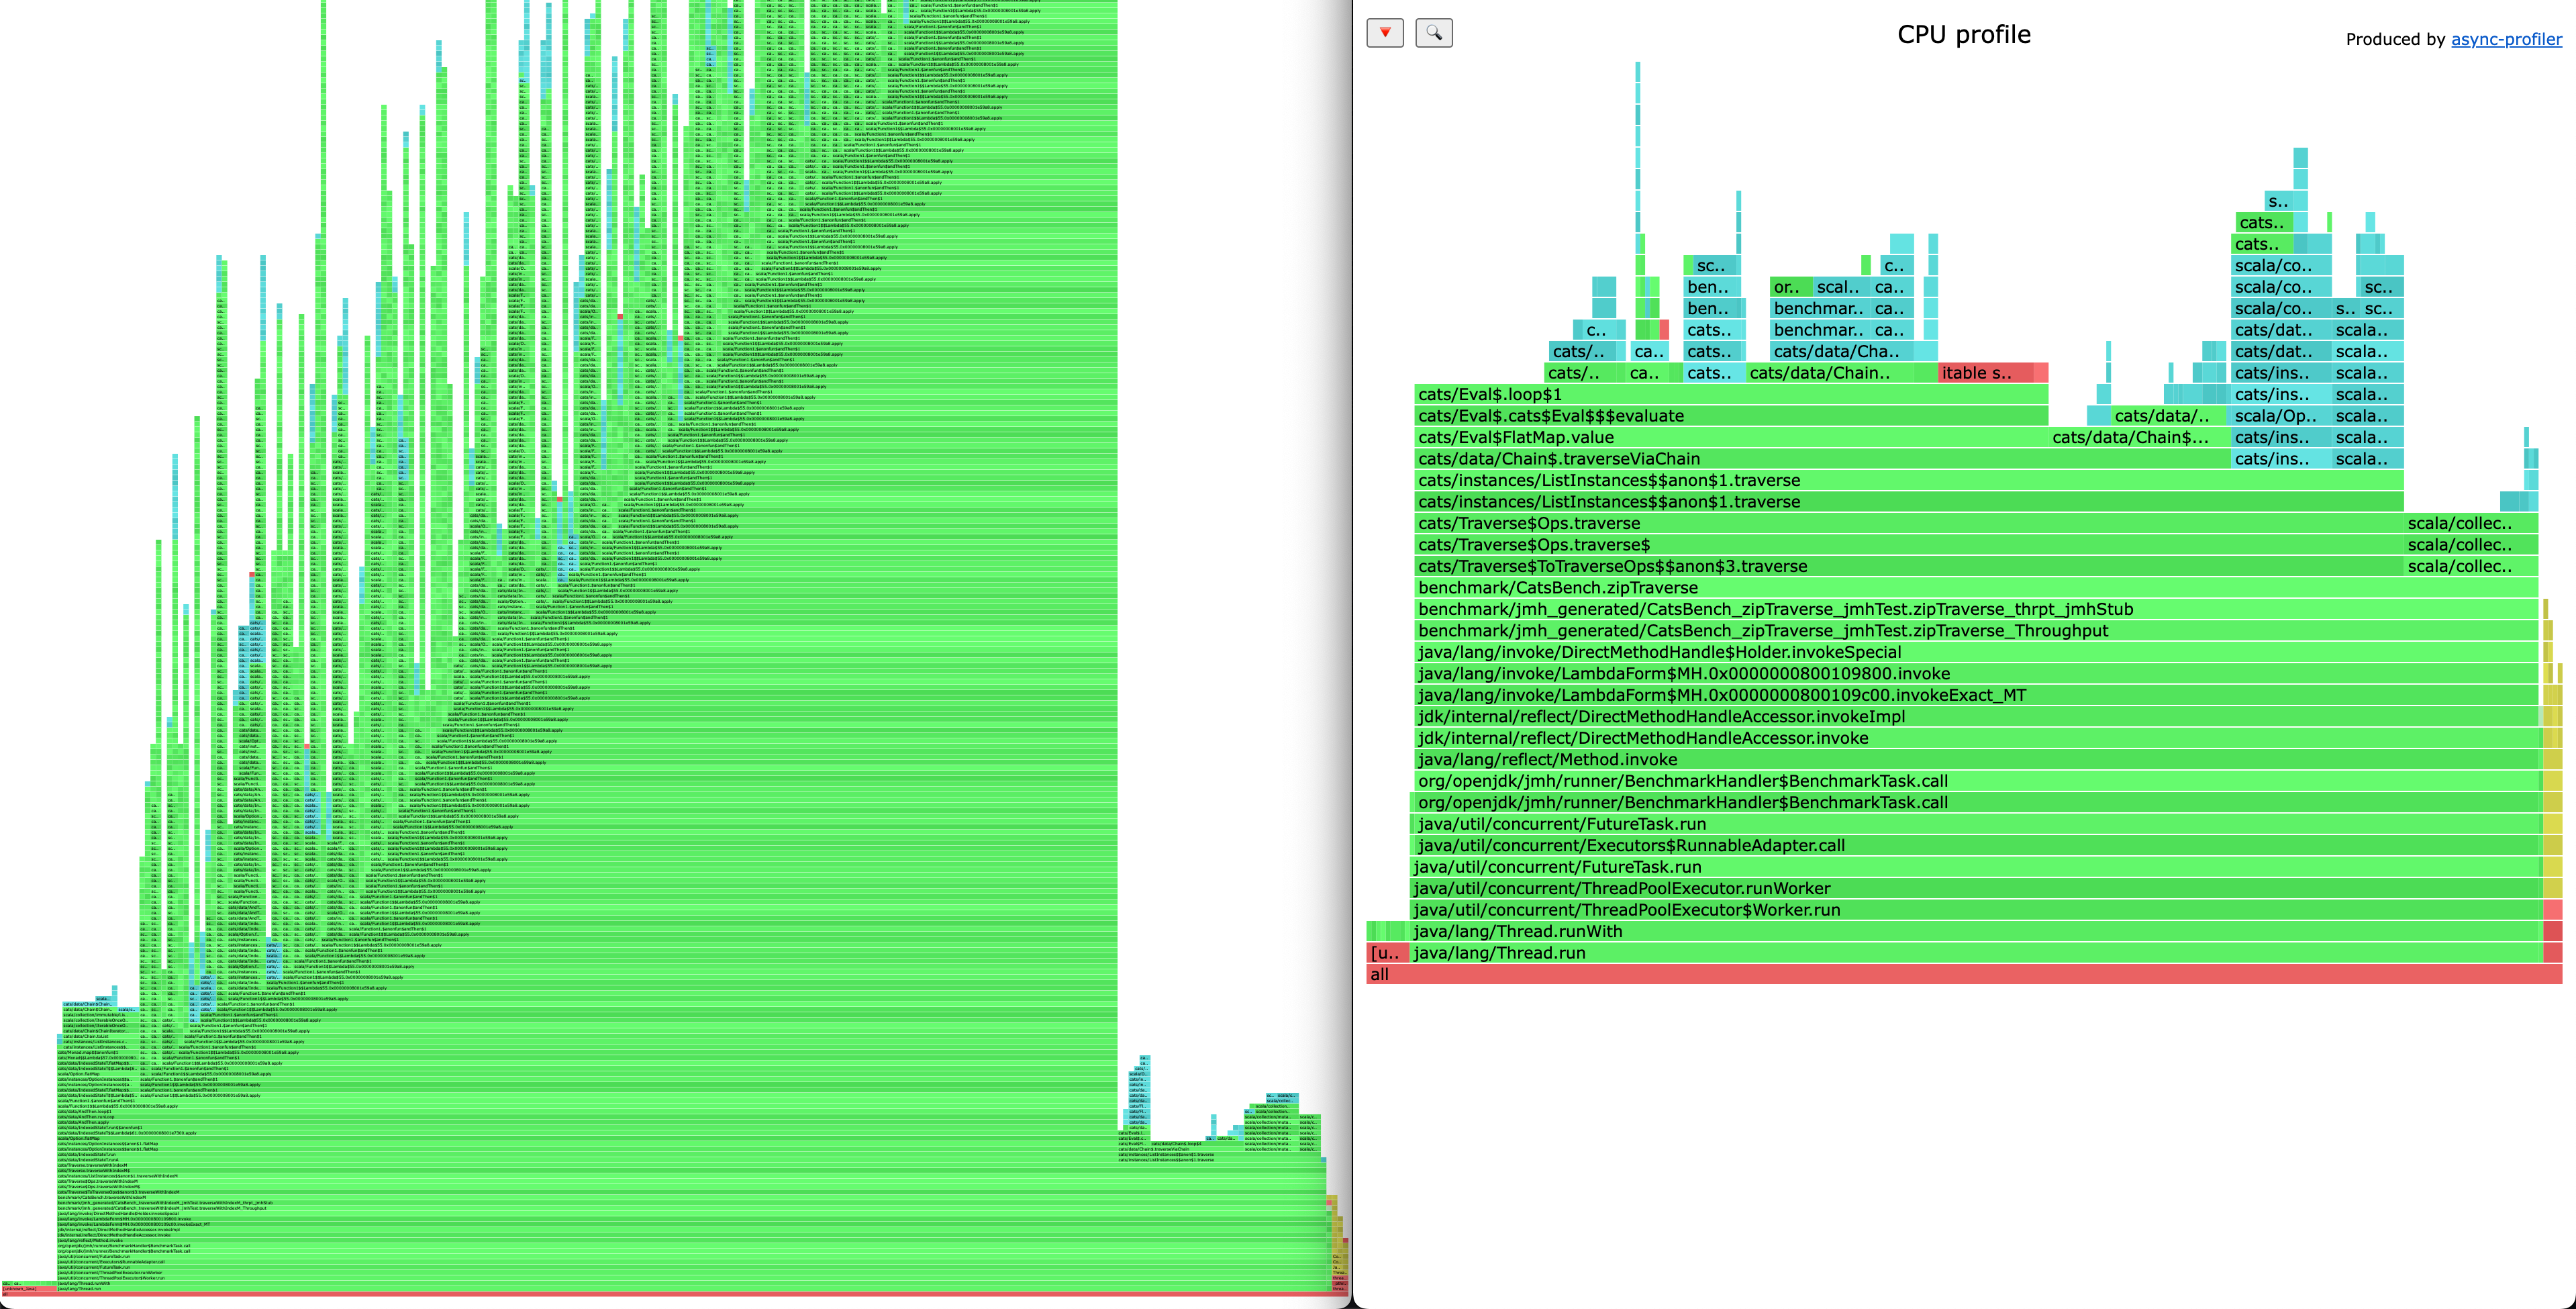
traverseWithIndexM creates a huge call stacks (that is something we should avoid) in contrast of zipWithIndex.traverse
Conclusion
We should prefer zipWithIndex.traverse over traverseWithIndexM in any case. We lose a bit of elegant with it, but we gain significant performance and reduce stackoverflow chance, which is a good trade off.